As systems engineers, we are often required to quantify and measure certain concepts that initially appear too abstract to get a handle on. This is often a problem at initial stages of the systems engineering lifecycle and particularly at project start up or engineering mobilisation phases of the project lifecycle. Customers (and comparative internal stakeholders with similar interests such as project control) will start making requests of the engineering team along the lines of “how secure is the solution”, or “how modifiable is it”? Whilst one would hope that any requirements team worth their salt has agreed a decent requirements set that are well parameterised, there will always be idealistic high level requirements that feel insufficiently defined and immeasurable.
Whilst the inexperienced engineer might make initial judgements based around convoluted methods of pseudo-assessment, there are a number of approaches that might be better suited and are worth examination. By pseudo-assessment, I refer to methods used to elicit approximations of quantification and measurement based on either subjective views from experienced Subject Matter Experts (SMEs) or reflective judgements based on measurements taken on related areas. “It is highly secure because we have built it in accordance with the RMADS” or “It is easily modifiable because it has a component based architecture” for example.
Described here is a formal method of quantifying abstract qualities such as information security, reliability or data quality and, where appropriate, applying metrics to those areas. The seasoned systems engineer will no doubt shrug off such methods as obvious, but not only do they deserve explicit mention (and thus this text) but perhaps clarification and where possible, references to real world area in which they can be used. This work is not my own, it is mainly based on a paper by Pontus Johnson, Lars Nordstrom and Robert Lagerstrom from the Royal Institute of Technology, Sweden. I came across it in the publication “Enterprise Interoperability – New Challenges and Approaches” , published by Springer which will set you back a little over a hundred pounds at current UK prices. For the “real” version (including the maths), see their paper titled “Formalizing Analysis of Enterprise Architecture”. My interpretation (or bastardisation!) is a personal account of some of the concepts and I do not claim to be the authority on this (disclaimer over!).
The description here is a considerably less formal than the paper from which it came, and no doubt will be criticised for this dumbed down description however, this serves only to re highlight its use and perhaps make it more accessible. If the reader enjoys getting involved in the maths, they are welcome to go and access the paper and produce their own interpretation. In fact this is encouraged.
Architecture Theory Diagrams
When looking to paramterise and measure an abstract property, a reasonable approach would be to examine what “goes into” that property to make it what it is. A simple format for this method would be as follows:
1) Decompose the abstract property into sub properties
2) Try to quantify and measure the sub properties
3) Aggregate the answered properties according to a schema to answer the initial abstract property.
This method makes a number of important assumptions:
1) You believe that the abstract property can be formally decomposed to suitable properties
2) You trust that the composition of the sub properties fully describe the abstract property
It will be noted that the method does not rely on the ability for sub properties of the abstract property to be sufficiently parameterised and measurable because step 2 of formal decomposition method is (theoretically infinitely) recursive and thus such sub properties will be found.
The Architecture Theory Diagram (ATD) approach extends this approach in a number of useful ways.
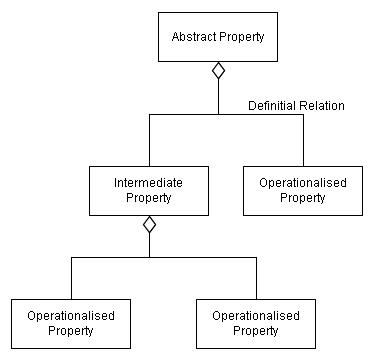
First, the ATD method formalises the nomenclature of abstract property decomposition by providing us with the following terms:
An Operationalised Property is property for which it is believed to be practicably possible to get a credible measure. That is to say that for the abstract property Information Security, Operationalised Properties might be properties such as Link Encrypted or Firewall installed (clearly both Boolean enumerated attributes).
Intermediate Properties are neither abstract nor operationalised. These properties exist only to serve the purpose of providing useful decomposition steps between the abstract properties and the operationalised properties.
Definitional Relations merely illustrate that a property is defined by its sub properties. This is broadly equivalent to a Composition relation in UML. The interesting use of the definitional relationship here is that they are to carry weightings. That is to say that each operational property is not equal and can be weighted according to its influence on the parent property. (Before anyone comments that the notation uses a UML aggregation symbol… this is the notation given for ATDs!)

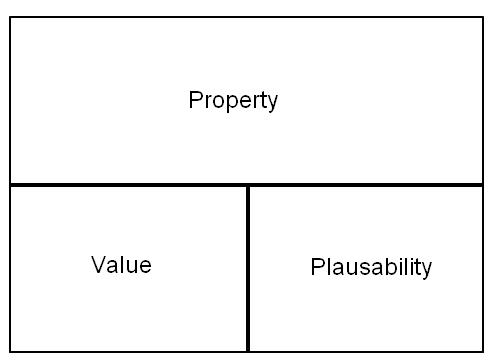
Operationalised Properties are then given property values, and this is where we receive even more flexibility. The values assigned, are derived from expert opinion, direct measurement or otherwise and values are enumerated according to a suitable schema. The “plausibility” factor is the belief that we have the property carries the value attributed (Dempster-Shafer Theory).

Hopefully you will quickly see that the following steps are to start aggregating the values back up the decomposition to enable a value to be calculated for the abstract property. The accumulation of value to the abstract property is according to the weighted definitional relations and from this the maths gets quite complicated. I shall make no attempt to explain it… partly because at points it is beyond me but, if this has started to give you a flavor of the “art of the possible” then I strongly encourage you to look for the paper (or get in touch) and use it for your own purposes.
The strength of this method is that it gains suitably credible values for abstract properties and can be backed up by some useful maths to do the computation for you. The weighted definitional relations and incorporation of Dempster-Shafer theory supply the useful format for compiling these values into a useful measure of the abstract property.
I would certainly encourage anyone that has a use to explore this method, or adapt it for their purposes and, as always, I would welcome comment, feedback or thoughts.


